By Andy Home /London
When the going gets tough, there’s always the cost curve.
An industry’s cost curve should determine where falling prices trigger a supply response as higher-cost producers start shuttering capacity.
Cost-curve dynamics have been under close scrutiny in markets such as aluminium and nickel for many months now as prices of both metals plumb depths not seen since the global financial crisis.
And now it’s copper’s turn.
On the London Metal Exchange, benchmark three-month copper this week hit a low of $5,164 per tonne, a level last seen in 2009.
So far only a handful of smaller mines have been shuttered but this week brought news that Freeport McMoRan, one of the world’s biggest copper producers, is running the ruler over some of its higher-cost operations.
However, as other metal markets have already found out, cost curves can be an unreliable friend to those looking for a price bottom.
Producers tend to hang on in there as long as they can, even if they’re losing money. It’s a natural response to the pain, both financial and social, of closing mines and plants.
Cost curves are themselves moving targets, falling and rising depending on a host of fluctuating factors ranging from currencies to energy inputs to by-product prices.
And, most problematically, cost-curve assessments are fuzzy for the simple reason that there are big gaps in our collective understanding of the supply chain.
The biggest knowledge gap of all for most industrial metals is China, itself a major production hub, but one that is fractured, disparate and opaque.
It’s the dynamic nature of the cost curve that has led Goldman Sachs, for example, to come out with its super-bearish view of copper pricing over the next few years.
Copper prices have not been falling in isolation. Rather, the entire commodity complex has been sliding, creating deflationary feedback loops. The most obvious part of this process is the falling cost of energy inputs to the mining and processing cost matrix.
Then there is the rise in the value of the US dollar, an ongoing macro theme right now. That tends to depress costs in local currencies such as the Chilean peso.
Goldman forecasts marginal copper production costs, defined as the 95th%ile on the curve, will fall around 30% from their peak of $7,000 in 2013 to $5,000 in 2017. This is by no means unprecedented. The bank’s analysts suggest that copper production costs slid by around a third during the last bear market in the 1990s.
Nor is Goldman alone in its assessment that costs are falling.
Thomson Reuters GFMS estimates that total production costs among 26 of the largest producers have fallen from $5,020 in Q2 2013 to $4,665 in Q1 2015.
The implication is that prices would have to trade consistently below $5,000 to generate a meaningful supply response.
Which is one of the reasons Goldman is looking at prices to average $4,500 per tonne both in 2017 and 2018.
The key assumption, hotly contested by other analysts, is that the market will remain in surplus over that period and require price-related supply adjustment rather than copper’s usual tendency to unplanned disruption.
However, not even the mighty Goldman knows much about the costs of production among China’s myriad miners, many of them small scale and privately owned.
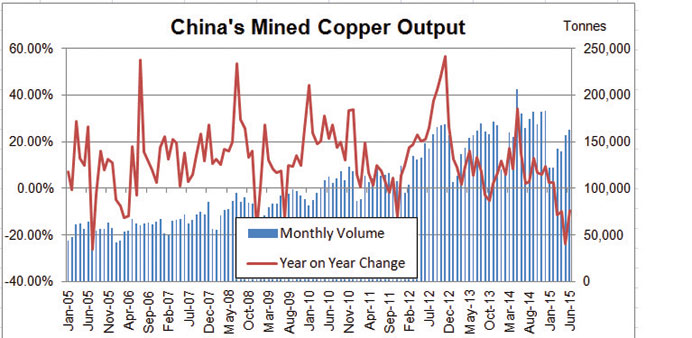
Actually, even working out how much China produces is a tricky proposition.
The official figures from the National Bureau of Statistics (NBS) are immensely volatile and widely suspected of including systemic errors. Last year, for example, Chinese mined production was 1.923mn tonnes, according to the NBS, even though its actual monthly figures totalled 1.995mn tonnes. Revisions there must have been but the NBS doesn’t publish them.
Analysts at Macquarie Bank say their “best estimate using other sources” is that China actually produced around 1.59mn tonnes. The problem is that whichever figure is right, it still makes China the second largest producer of mined copper after Chile.
And, just about everyone agrees, significant parts of China’s copper mining sector sit at the very top end of the global cost curve.
But exactly how much production and where precisely on the cost curve are “known unknowns”. Certainly, there are reports coming out of the country that some smaller mines are already closing or at the very least withholding sales.
l Andy Home is a columnist for Reuters. The opinions expressed are his own.